
Choosing your tools
Charting software: choose tools for your workflow
Charting software turns market data into charts you can inspect with timeframes, drawings and indicators. ChartArrow combines free crypto, stock and forex charting tools with AI-assisted analysis. The right platform depends on whether you need chart research, custom scripts, a community or broker-connected execution.
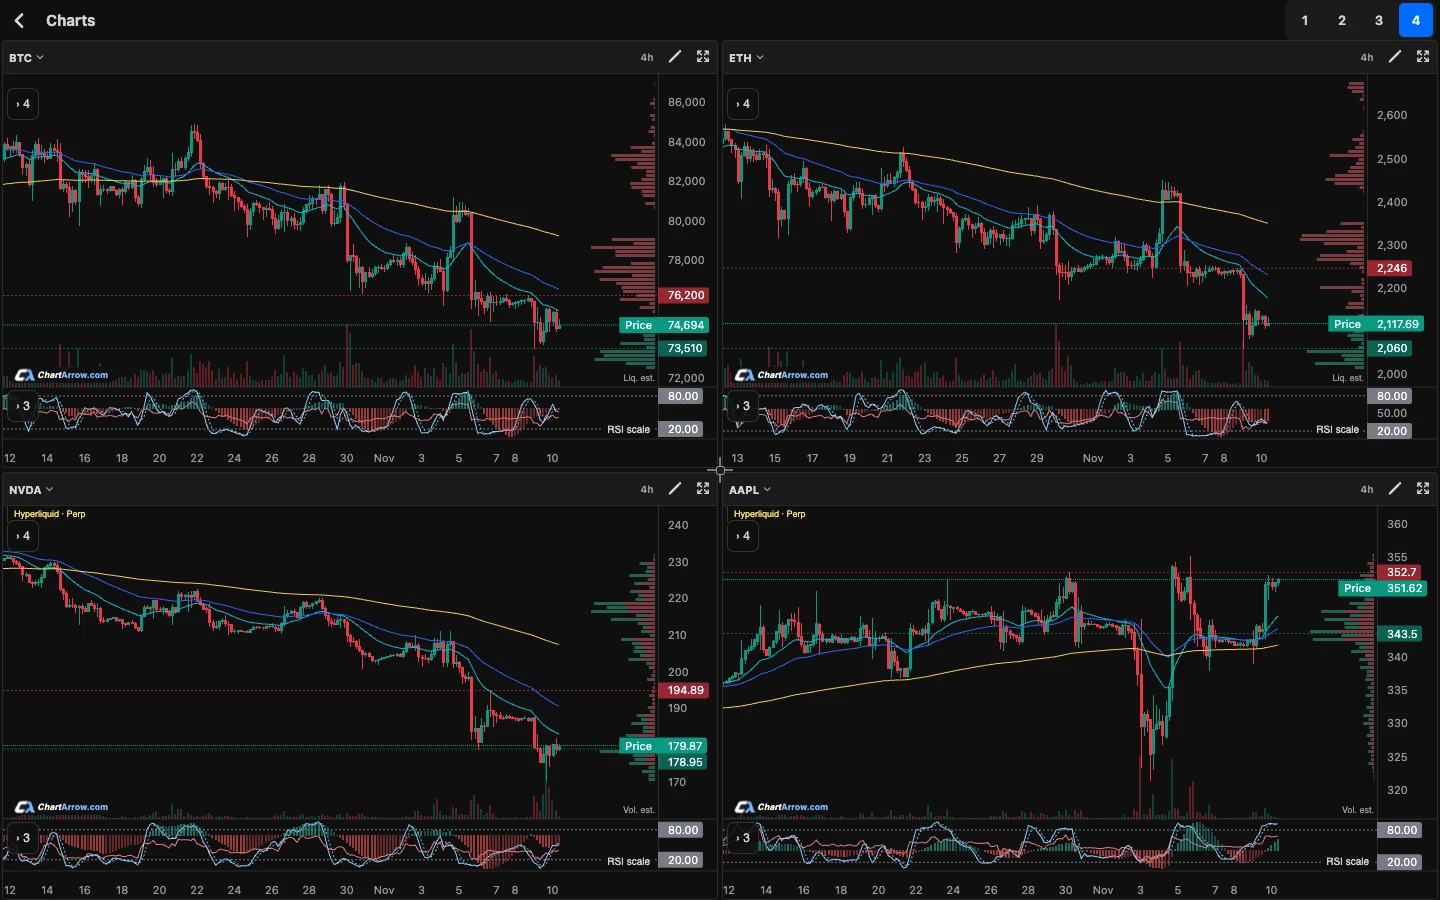
Which type of charting platform do you need?
Start with the job you want to complete. A research workspace helps you read a chart. A scripting environment lets you define indicators or strategies. A broker-connected platform handles orders and positions. One product may cover several jobs, but sharing a candlestick chart does not make two platforms interchangeable.
For AI-assisted research, check whether you can question the explanation and edit the result. For execution, check the actual broker, instruments, account permissions and order handling. An AI conversation does not establish that an application can place a trade.
Crypto, stock and forex charts: check the instrument first
| Market | What to check | Useful ChartArrow workflow |
|---|---|---|
| Crypto charts | Exchange, quote currency, spot versus derivative, and candle interval. Similar tickers can describe different contracts. | Keep the same pair and source across a multi-timeframe layout, then inspect the broader structure before the smaller chart. |
| Stock and ETF charts | Exchange, trading session, source labels and any delay. A stock-linked perpetual is a separate instrument from a share. | Read the share-versus-perpetual distinction before comparing a regular-session chart with a 24-hour quote. |
| Forex charts | Currency-pair direction, source, timestamp and session. Quotes can differ between data providers. | Use the same pair and timeframe while reviewing support and resistance; check your broker's actual quote separately. |
ChartArrow also supports indices and commodities. Availability, history and update timing vary by instrument and are labelled in the app. Supported-market coverage is not a promise of every exchange, contract or real-time feed.
How do ChartArrow, TradingView and MetaTrader differ?
| Platform | A reason to evaluate it | What to verify |
|---|---|---|
| ChartArrow | Browser chart research with available GPT, Claude and Grok perspectives, follow-up chat and editable AI drawings. | AI capability and account limits, source labels and the tools you need. These charting and AI features do not execute trades. |
| TradingView | Charting with Pine Script, published ideas and broker connections supported by TradingView. | Required plan, market data and broker support. Read the ChartArrow versus TradingView comparison. |
| MetaTrader 4 / 5 | Broker-based trading workflows, platform indicators and Expert Advisors. MT4 and MT5 have different capabilities. | Broker availability, actual instruments, supported platform and automation compatibility. Read the MetaTrader comparison. |
Browser access alone is not a unique differentiator: other platforms also offer web experiences. Choose using the complete workflow. ChartArrow can be useful alongside a broker terminal for separate chart research; that does not mean accounts or orders are connected.
What should you check in charting software?
- Instrument identity: confirm the exchange, contract and source, not just the company name or ticker.
- Data timing: look for delayed or refreshing quotes, incomplete candles and limited history.
- Chart control: try the intervals, indicators, drawings and layout you actually use.
- AI transparency: ask what evidence supports a claim and whether you can correct a drawing.
- Alerts: distinguish price conditions from indicator values, and confirm notification prerequisites.
- Storage: establish whether work is saved on the same device or synchronised elsewhere. ChartArrow saves drawings and per-ticker layouts on the same device.
- Execution: check who holds funds and places orders, if anyone. Charting access does not imply brokerage access.
- Total access cost: separate free charting, AI allowances, data subscriptions and any broker charges. Review current terms rather than an old comparison price.
How can you compare tools using the same chart?
- Choose one supported instrument and a completed historical candle range. Record the symbol, source, timeframe and time of observation.
- Mark one visible support or resistance zone manually. Use the same indicator settings on each platform.
- Compare how easily you can inspect candles, change a drawing and find the data-source label.
- If using AI, ask for two plausible interpretations and what evidence would challenge each. Compare the explanations with the actual chart.
- Record missing features or unclear data. A useful explanation or a visually appealing chart is not proof of future trading results.
This exercise compares usability and clarity. It is not a backtest or a claim that one platform produces more profitable trades. See how AI analysis differs from signals and trading bots before evaluating automation claims.
What is free in ChartArrow?
Charts, watchlists, multi-chart layouts, indicators and drawing tools are free. You can compare up to four charts in one workspace. Eligible accounts can try one AI analysis and a daily chat allowance; paid plans add AI usage. Model access and limits depend on account and plan. Check current pricing and allowances.
Open ChartArrow in a desktop or mobile browser. For iPhone, follow the Home Screen web-app guide. Begin with a single chart, then add panels when they help answer a specific question.
Sources and comparison scope
Reviewed 15 November 2026. ChartArrow publishes this guide about its own product; it is not an independent survey or exhaustive list of charting platforms. Competitor capabilities are summarised from TradingView's official features, MetaTrader 4 and MetaTrader 5. Plans, brokers and platform-specific features can change. TradingView and MetaTrader are their owners' trademarks; no affiliation is claimed.
Published by ChartArrow about its own product. Educational information, not financial advice. AI can be wrong.