
Product guides
How to read support and resistance zones
Support and resistance describe areas where price has reacted before. Learn to mark those areas, question a possible breakout and keep your chart context clear.
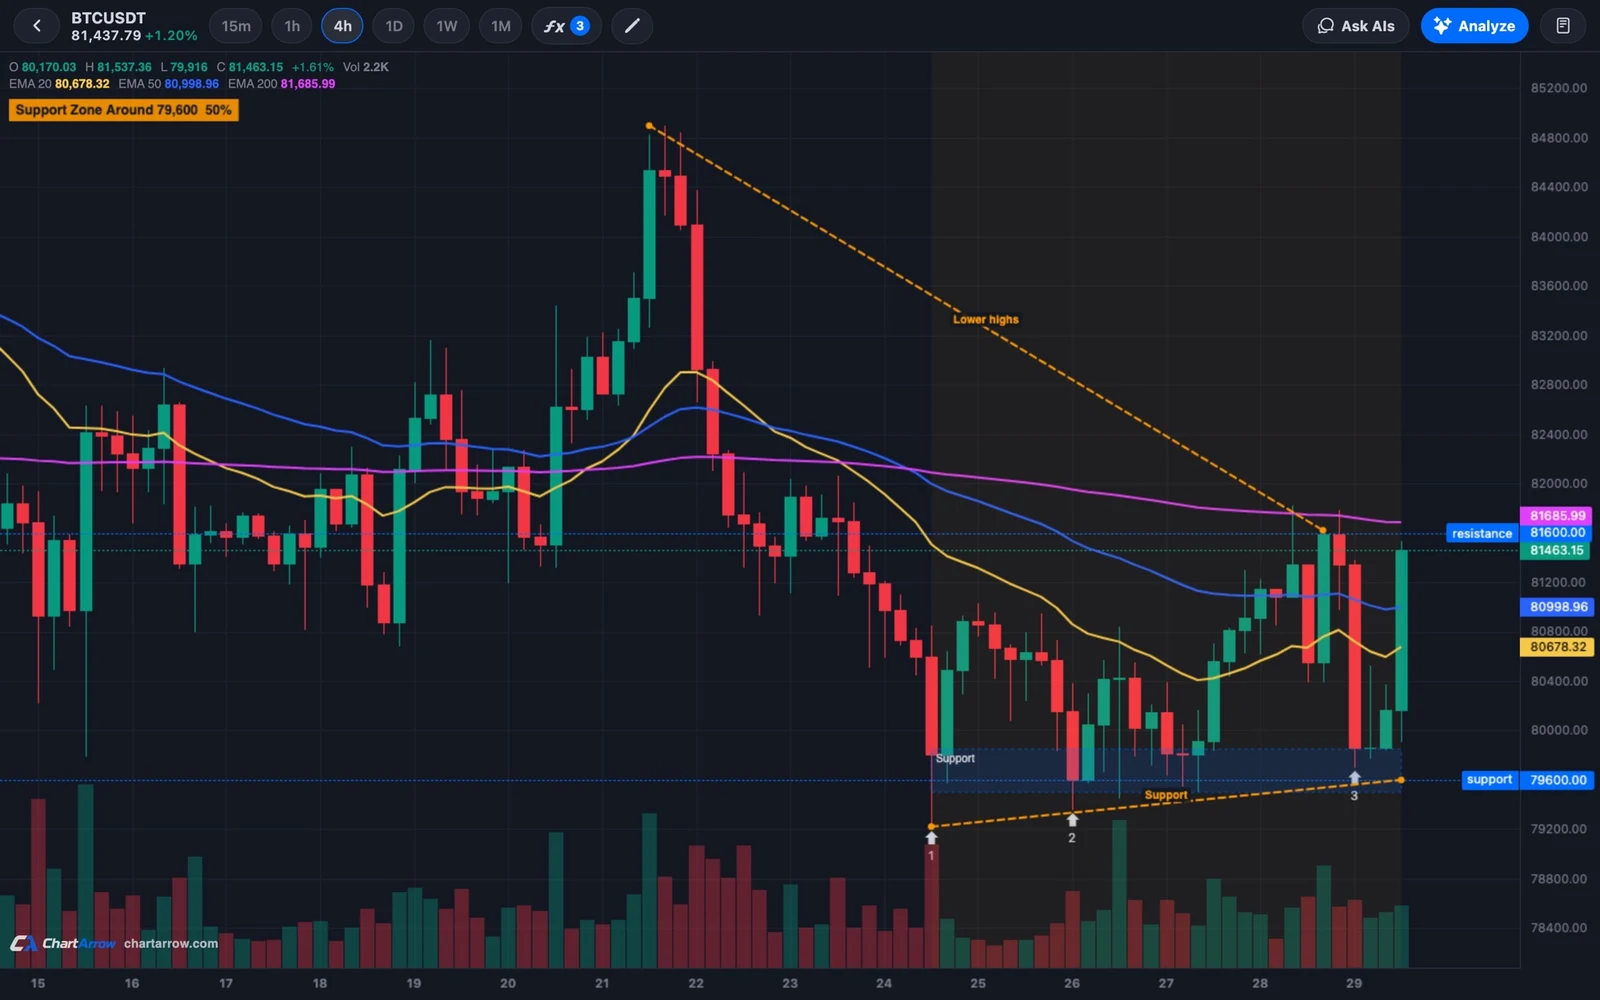
What a zone means
Support is an area where a falling price has previously met buying interest or stopped falling. Resistance is an area where a rising price has previously met selling interest or stopped rising. These names describe past reactions, not barriers that must hold in the future.
Think of an area rather than a perfectly precise line. Candles can turn at slightly different prices, and a quick wick through a level can coexist with closes on the other side. A zone is a way to group nearby reactions so that you can see the uncertainty around a level.
Mark reactions on a chart
Start with the instrument and timeframe you want to study. Look for areas where price changed direction more than once. Note the candle bodies and closes as well as the wicks: a wick shows how far price reached during the period, while a close shows where that candle finished. Neither tells the whole story alone.
Draw a zone wide enough to include the relevant cluster without swallowing unrelated price action. Look left across the visible history and ask whether earlier reactions support the same area. Keep the number of markings manageable; covering the chart with overlapping zones can make a comparison harder.
Also consider the surrounding trend and the distance between touches. Two nearby candles in one short move may be less informative than reactions separated in time. Different people may reasonably choose different boundaries for the same area.
A hypothetical Bitcoin example
Imagine a BTC chart where price falls toward $60,000–$61,000 on several occasions and then rises. You might mark that range as a possible support zone. One candle might wick to $59,800 before closing back above $60,000, while another turns near $60,700. The reactions are close, but they are not identical.
If price later returns, observe how it behaves around the whole range rather than treating $60,000 as a guaranteed floor. A close below the zone, a return above it or movement straight through it are all possible. These figures are invented to explain the method and are not current market levels.
Breakouts and false breakouts
A breakout is a move beyond an observed area. A candle that briefly passes resistance but closes back inside the zone can be described as a false breakout. The same idea applies in reverse below support. Labels become clearer only with the context and subsequent candles; a candle still forming can change before it closes.
Some observers wait for a close beyond an area or watch a later revisit. Neither condition guarantees the next move. When reviewing a chart, record what you actually observed and what would make you reassess the zone instead of assuming a breakout has confirmed a forecast.
Timeframe and source matter
A zone visible on a daily chart may look different on an hourly chart. Compare the same instrument and source before deciding the views conflict, and check whether a candle is complete. Our multi-timeframe guide explains how to organise that comparison.
Use price and indicator alerts to revisit a level, remembering that an alert is a notification condition, not confirmation of a reversal. If momentum is part of your review, see RSI versus Stochastic.
Ask AI, then inspect the drawing
“On this chart and timeframe, mark the main support and resistance zones. Explain the visible reactions behind each zone and identify any uncertain boundary.”
Check the suggested areas against the candles and source label. ChartArrow drawings can be edited directly, so adjust a boundary if your review supports a different one. The AI can misread a chart; a neat drawing does not make an interpretation reliable. Find more examples in AI chart prompts, or start with the getting-started guide.
Educational guidance, not financial advice. Examples are not trade recommendations.