
Compare up to four charts in one workspace
ChartArrow's multi-chart workspace lets you compare up to four charts. Put different symbols or timeframes side by side and keep the context visible while you explore a setup.
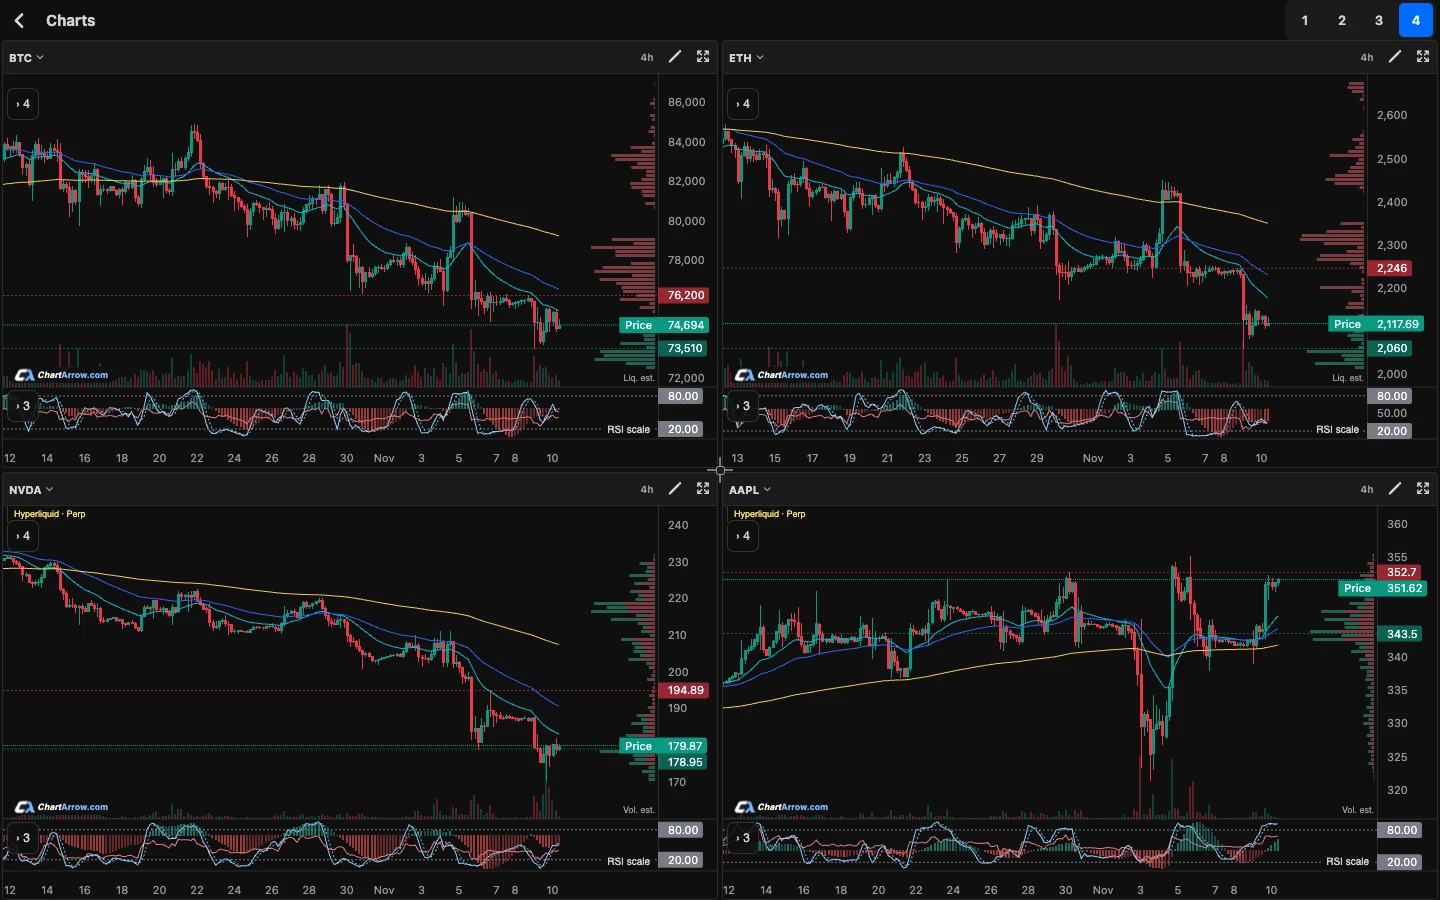
Build a multi-chart layout
- Open the multi-chart workspace.
- Add charts and choose the symbols and timeframes you want to compare.
- Resize panels or expand a chart when you need a closer look.
- Return to the multi-chart view to compare the setup with the other panels.
Compare markets or timeframes
Use one layout to compare Bitcoin and Ethereum, or view one market on different timeframes. Supported stocks, ETFs, forex, indices and commodities give you additional context. Each instrument's source and data availability still apply.
A layout for comparing timeframes
Try the same instrument in daily, four-hour and hourly panels as a learning exercise. Check that every panel uses the intended instrument and source. Read the broader structure first, then use the smaller interval to inspect how the recent move developed. The multi-timeframe guide walks through this process and its limits.
A layout for comparing markets
Put two or more supported symbols beside each other to inspect their behaviour over a similar period. Check each source, timeframe and quote currency. A visually similar move does not establish a stable correlation, and a percentage move in one instrument is not directly comparable with the raw price scale of another.
Does an AI response analyse every panel?
Check the context of the analysis you open. A response for one symbol and timeframe should not be treated as an analysis of the entire workspace. Expand the relevant chart, ask a focused question, and compare its explanation with your other panels yourself.
Where is my layout saved?
ChartArrow preserves drawings and per-ticker layouts on the same device as you move between full and multi-chart views. Do not assume cross-device or cross-browser synchronisation. If a setup seems missing, check the symbol and browser context before clearing website data.
What do 24-hour stock charts show?
For supported stocks, ChartArrow can display stock-linked perpetual prices alongside regular-session share prices. Perpetuals are separate instruments, not shares, and can trade at different prices. Sources and delays are labelled. Older share history may be labelled when it extends beyond the perpetual's available range. Read the shares-versus-perpetuals guide for a comparison of sources, sessions and historical coverage.
Are multiple charts free?
Yes. Multi-chart layouts are included with the free charting tools. Additional AI usage is governed by the current account allowances and plans.
Watch the 30-second multi-chart demo or learn about indicator alerts.
Not financial advice. AI can be wrong.