
AI chart analysis you can question and edit
Compare perspectives from GPT, Claude and Grok on the chart you are viewing. Explore potential patterns and key levels, ask follow-up questions, then edit AI drawings to build your own view.
What does AI chart analysis actually do?
AI chart analysis uses a model to interpret the chart context it receives. ChartArrow uses AI to discuss potential patterns and support and resistance, answer follow-up questions and create chart drawings you can edit. It is not a verified forecast, an instruction to place a trade, or proof that all market information has been considered.
A useful response should explain why a level or structure matters and acknowledge ambiguity. If a model gives an unexplained target, ask which visible evidence supports it and what would invalidate the interpretation.
How to analyse a chart with AI
- Open ChartArrow and choose a supported symbol and timeframe.
- Use AI analysis or chart chat to explore the visible setup. For example: “Explain the support and resistance on this chart.”
- Read the reasoning and check the levels against the candles. The AI may find no clear setup.
- Ask a follow-up question or request a drawing change. Move, edit or remove the drawings yourself, and use Undo to step back.
Work through a real example
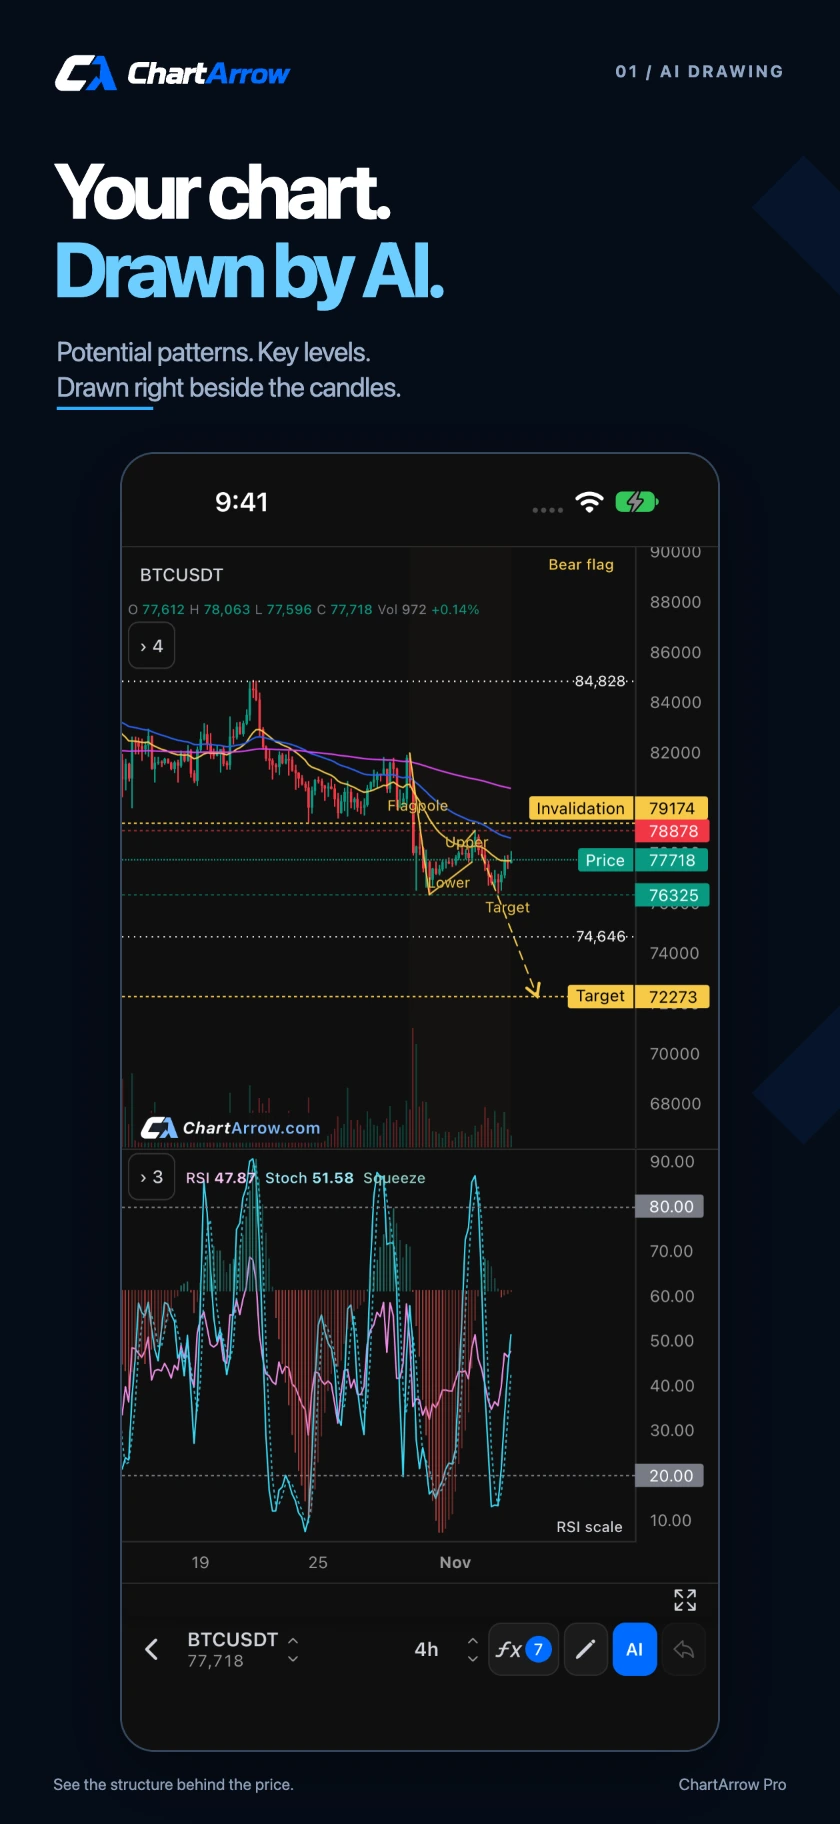
The Bitcoin screenshot above shows a possible bear-flag interpretation, an invalidation level and a projected target. First compare the drawn boundaries with the candles. Then ask whether the structure is complete or still developing. Finally inspect the invalidation: it describes a condition that would challenge the interpretation, not a promise that risk is contained there.
The example is a saved product capture, not a current market call. A projected target may never be reached. Use the chart-prompt guide for questions that challenge the model rather than simply asking it to predict a direction.
Which AI models does ChartArrow use?
Available GPT, Claude and Grok models can offer different readings of the same chart. Comparing them helps you examine assumptions; agreement does not prove a prediction. Model availability and AI usage depend on your account and plan.
Keep control of the drawings
AI drawings remain editable. Adjust a line or level directly, ask chart chat to change it, or add your own analysis. Drawings and per-ticker chart layouts are saved on the same device and can be used across full and multi-chart views.
AI chart chat or multiple charts?
Use chart chat to explore the current chart and refine a drawing. Use up to four chart panels to compare symbols, or multiple timeframes to inspect broader and shorter-term context. When you switch panels, check which symbol and timeframe the AI response describes. Do not assume that a response about one chart automatically incorporates every other panel.
Which markets can I explore?
ChartArrow supports crypto, stocks, ETFs, forex, indices and commodities. Data availability and delays vary by instrument. Supported stock-linked perpetuals have separately labelled 24-hour quotes; they are separate instruments from the underlying shares and can have different prices.
How can I use AI chart analysis for crypto, stocks and forex?
Crypto: choose a specific pair, exchange or source and timeframe, then ask the AI to explain the visible range and reactions near a support or resistance zone. Confirm whether the chart shows spot or a derivative before comparing it with another platform.
Stocks and ETFs: check the source and session before asking about a level or trend. A supported 24-hour stock-linked perpetual is a different instrument from the company's shares. Ask the model to state which chart it is discussing and what context is unavailable.
Forex: keep the currency pair, source, timeframe and indicator settings explicit. If a short-term rise sits inside a broader decline, use separate timeframe views to inspect the disagreement. With RSI or Stochastic, ask for an explanation of the reading instead of treating an overbought or oversold label as a trade instruction.
These are chart-reading exercises. See AI chart assistants versus signals and trading bots for the distinction between analysing a market and executing orders. If you are comparing platforms, start with the charting software checklist.
Free charts and AI access
Charts, watchlists, multi-chart layouts, indicators and drawing tools are free. Eligible accounts can try one AI analysis and a daily chat allowance. Paid plans add more AI usage. Eligibility and AI limits depend on your account; check the current plans and allowances before subscribing.
Does ChartArrow execute trades?
No. ChartArrow provides charts, alerts and AI-assisted analysis. It does not hold your funds, place orders or execute trades for you through these features. The service terms explain the scope of the product. AI output is educational information, not personal investment advice.
Can AI chart analysis be wrong?
Yes. It can identify a pattern that is not meaningful, miss a relevant level, confuse context or produce an incorrect explanation. Comparing several models can reveal different assumptions, but agreement is not evidence of a known success rate. Check the source data, the visible candles and the actual drawing yourself.
Where should a new user start?
Follow the free-chart walkthrough, then ask one specific question about one instrument and timeframe. Keep your first request simple enough that you can verify the answer visually.
Not financial advice. AI can be wrong.