
Product guides
Better questions for your AI chart analyst
A useful chart question names the context and asks for evidence. These prompts help you inspect what ChartArrow sees, challenge its interpretation and keep control of the drawings.
How can I ask AI to read a candle without inventing prices?
Start with one completed candle, its instrument, source and timeframe. Read its open, high, low and close yourself. The candlestick guide and worked examples explain which values form the body and wicks, and why the same candle can hide different paths through the interval.
“For this instrument, source and timeframe, explain what the latest completed candle shows. Use only candle values actually available in this context. If a value is missing, say so instead of estimating it. Separate observations from interpretations.”
Compare the response with the chart's readout. A candle rising from its open does not necessarily mean the price rose from the previous close. If you provide values yourself, label the candle's timestamp and keep the same source. Review crypto pair and contract details or stock sessions and data labels before interpreting a mismatch.
Start with the chart context
Choose the symbol and timeframe before asking. Verify the source label and whether the current candle is complete. If you switch to a different instrument or timeframe, state that context again rather than assuming an earlier answer still applies.
A compact question is often enough: “On this BTC chart and timeframe, explain the trend, nearby levels and what you cannot tell from the available data.” Request analysis of what is visible; do not assume the model has live news, order-book data or every other timeframe.
Need help choosing a market first? Follow the getting-started walkthrough before using these prompts.
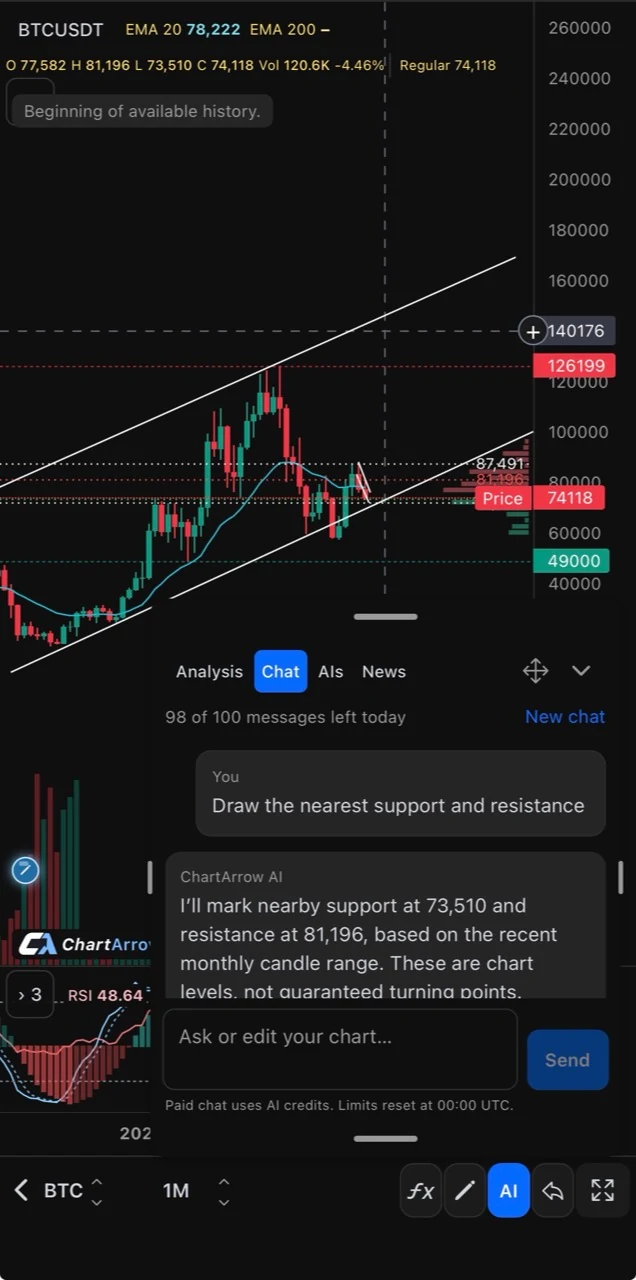
Find support and resistance
“Mark the main support and resistance zones. Explain which price reactions support each one, and which level is least certain.”
Check whether the proposed zones line up with the candles. A level touched once may have a different basis from an area with repeated reactions. Ask why a zone is useful before keeping it on your chart. A line drawn with precision is not proof that the market will respect it.
For a worked example of zones, wick reactions and apparent breakouts, read how to find support and resistance.
Challenge a possible chart pattern
“Is there a clear pattern here, or is the structure too ambiguous? Explain the evidence against your preferred interpretation as well as the evidence for it.”
Look for a response that distinguishes an emerging structure from a completed one. A model may find no clear setup. If its explanation relies on a breakout, check whether the relevant candle has actually closed beyond the stated level.
Ask what would change the interpretation
“Describe a continuation scenario and a failure scenario. What observable change would make you reconsider each one? Do not invent a probability.”
This asks the model to expose assumptions. It does not turn those scenarios into forecasts. Compare the conditions with your own assessment and remember that price can move through levels without warning.
Turn a vague edit into a specific request
“Keep the existing support zone, remove the extra projection, and explain which drawing you changed.”
Inspect the result after each edit. You can also adjust the AI drawings directly. For several changes, make one clear request at a time so that it is easier to see what happened. Use Undo for supported recent actions when you need to step back.
Compare model views without counting votes
“Which assumptions in this interpretation are strongest, and which could be wrong? Separate what the chart shows from what you are inferring.”
Available GPT, Claude and Grok models can disagree. Read the reasons rather than treating agreement as a confidence score. Several models can share the same blind spot, and their availability and usage depend on your account and plan.
Explain conflicting timeframes
“On this hourly chart I see a recent rise, while the daily view is still in a range. Explain what the current chart supports and what additional evidence you would need before calling this a broader trend change.”
Describe the other view yourself or open its chart context before asking about it. A response to one panel does not prove that the AI can see every panel. Follow the multi-timeframe analysis guide to keep the instrument and source consistent.
Review RSI and Stochastic readings
“My hourly RSI uses a 14-period setting and is near 70. Explain what that reading describes, why it does not prove a reversal, and what price context I should review.”
Replace the example with the settings and reading shown on your chart. If the model cannot see the indicator values, include them and ask it to state that limitation. The RSI vs Stochastic comparison explains why the indicators can disagree.
“I want to review the chart if the selected Stochastic line crosses 20. Help me describe the timeframe, indicator settings and condition I need to check before saving an alert.”
This asks for an explanation, not proof that an alert was created. Use the actual indicator-alert controls to choose the supported line and condition, save it, then inspect the saved alert. An indicator threshold of 20 is not a price of $20. A triggered condition is a prompt to review the chart, not an instruction to trade.
Check every answer before relying on it
- Does it refer to the correct instrument, source and timeframe?
- Do the described levels match the visible candles?
- Does it distinguish completed candles from a candle still forming?
- Does it acknowledge uncertainty or missing information?
- Did the drawing edit actually produce the change you requested?
Do not ask for guaranteed returns, a “sure trade” or an unsupported accuracy percentage. ChartArrow provides educational analysis, not automated trade execution. For the wider workflow, see how AI chart analysis works.
Educational product guidance, not financial advice. AI can be wrong. Examples are not trade recommendations.