
Market guides
Crypto charts: read the right market first
Free crypto charts are most useful when you know exactly which market you are looking at. Choose the pair, source and instrument type first, then use timeframes, volume and your own drawings to explore the price action.
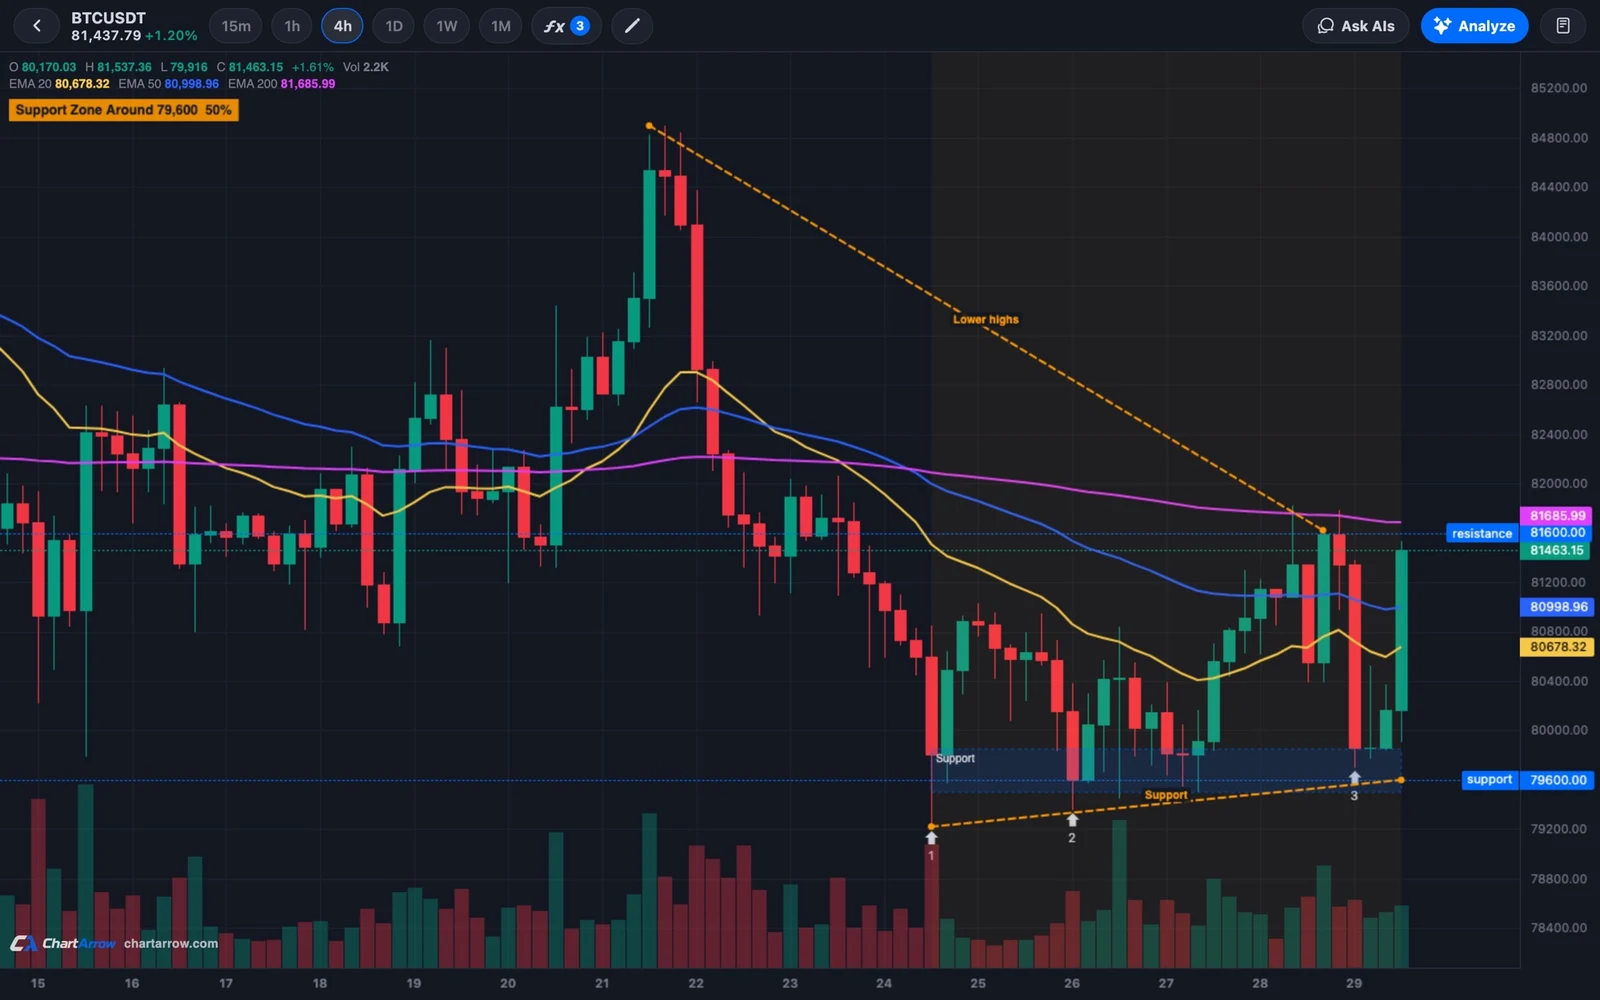
Which crypto market am I looking at?
A pair has a base asset and a quote currency: BTC/USD describes Bitcoin priced in US dollars, while BTC/USDT uses a different quote asset. Check both sides of the pair and the source shown in the app before comparing prices. Venues can have different trades and liquidity, so a similar ticker does not guarantee the same candles.
A spot chart represents the selected spot market. A perpetual is a separate derivative contract without a fixed expiry; its price can differ from spot and its venue can apply funding. Check the instrument label and the venue’s contract terms before drawing conclusions. A chart alone does not establish that you own an asset or hold a position.
How should I use timeframes and volume?
Start with a broader interval to identify the range or trend, then inspect a shorter interval for how price behaves near a level. Keep the pair and source consistent. The current candle is incomplete until its interval ends, so its high, low, close and volume can still change. See the multi-timeframe walkthrough.
Volume describes activity reported for the selected market and interval, not necessarily all trading across every venue. Compare volume against nearby candles on the same source; a high reading can accompany buying and selling and does not by itself predict direction.
A practical crypto chart exercise
- Choose a supported pair and note its source, spot or perpetual label, and observation time.
- On a broader timeframe, mark a visible range high and low. Use zones rather than assuming a single exact price must hold.
- Open a shorter timeframe for the same market. Inspect completed candles near a boundary and compare their volume with nearby bars.
- Write down one interpretation and an alternative. Identify what price action would challenge each, then adjust your drawings if the evidence changes.
For more on marking areas, read support and resistance. You can use up to four free chart panels when comparing views, but check each panel’s instrument and timeframe.
What can I ask AI about a crypto chart?
With an eligible account, try this question on the chart you are viewing:
“For this pair and timeframe, describe the visible range and the evidence for it. What alternative reading fits the candles, and what would challenge each interpretation? Note any missing context.”
Check the answer against the actual candles and source. Available GPT, Claude and Grok models can offer different perspectives, subject to account access. AI drawings can be moved or edited; an explanation or agreement between models is not a forecast. Explore more chart prompts.
Are crypto charts free, and what is included?
ChartArrow’s charts, watchlists, indicators, drawing tools and layouts of up to four panels are free. Eligible accounts can try one AI analysis and a daily chat allowance; paid plans add AI usage. Check current plans and allowances. Availability and delay vary by instrument, so read the labels in the app.
You can use ChartArrow in a browser or add it to an iPhone Home Screen. Drawings and per-ticker layouts are saved on the same device. Price, RSI and Stochastic alerts are also available; see indicator alerts. ChartArrow does not hold funds or execute orders.
Educational information, not financial advice. AI can be wrong.