
Product guides
Read one market across several timeframes
Multi-timeframe analysis means looking at the same instrument over different candle intervals. ChartArrow lets you keep up to four charts visible, so you can compare the broader structure with a closer view.
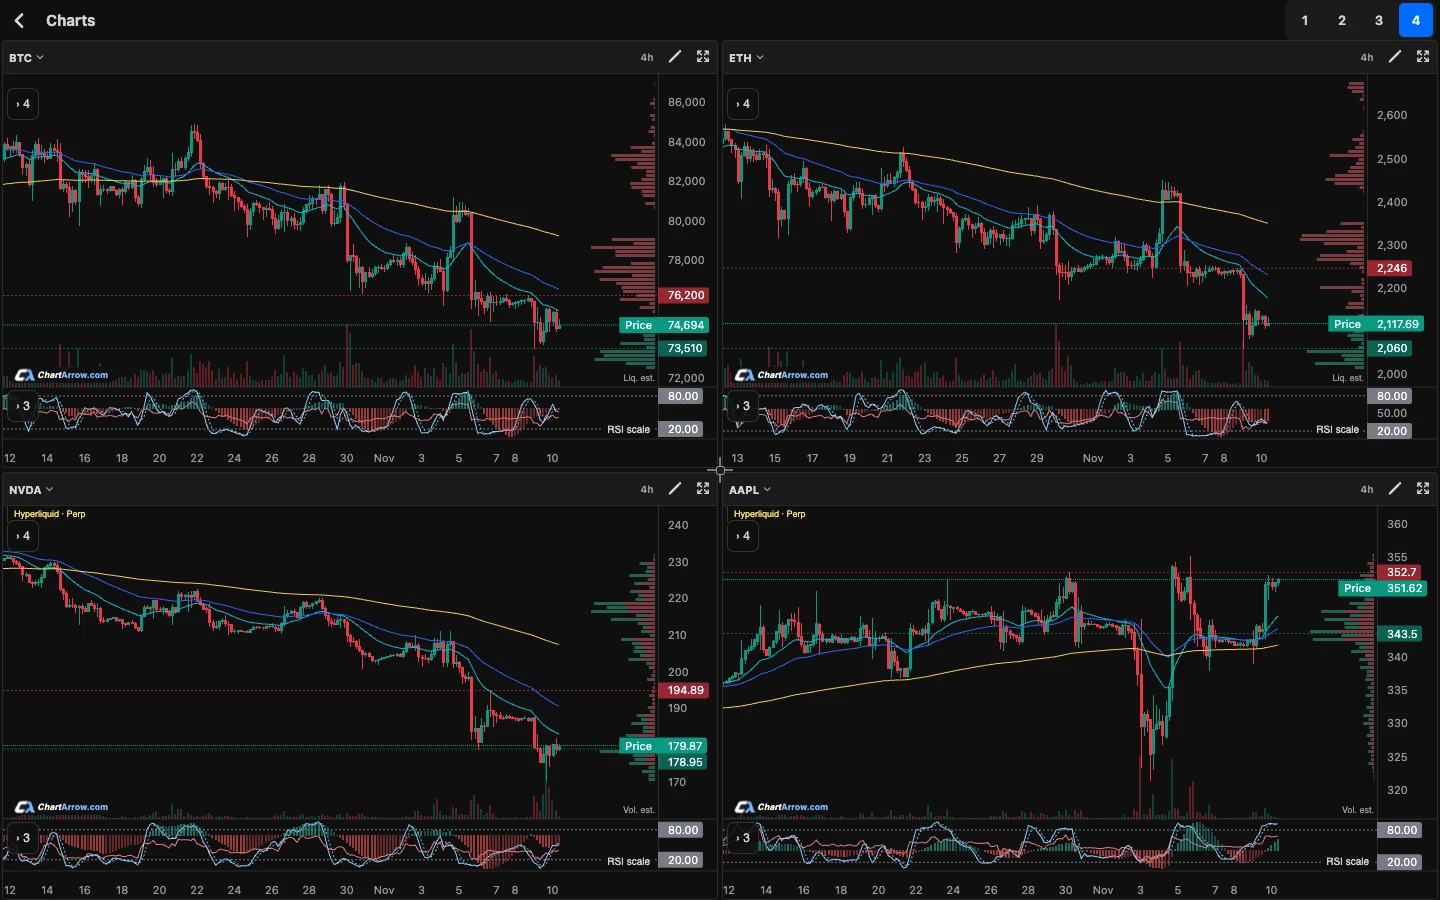
Build a layout that answers one question
Open the multi-chart workspace. For a learning exercise, choose the same instrument in three panels and set daily, four-hour and hourly intervals. Use the fourth panel only if it adds useful context. The example is a reading exercise, not a recommended trading strategy.
Match the instrument and source across the panels. Comparing a spot pair with a perpetual, or shares with a stock-linked perpetual, introduces a second difference beyond timeframe. That can be useful intentionally, but it is not a clean comparison of the same market.
For the share-versus-derivative distinction, see how 24-hour stock-linked perpetual charts differ from share prices.
Read the broader chart first
On the daily view, identify the visible range, recent major highs and lows, and areas where price has reacted. Describe the structure in plain language before naming a pattern. If you cannot distinguish a trend from a range, record the uncertainty.
Mark only the levels you can explain. Too many lines make the smaller chart harder to read and can give the impression that every move was anticipated.
The support and resistance guide shows how to describe zones and question apparent breakouts. If you compare momentum as well, keep the RSI or Stochastic settings visible rather than treating every reading as interchangeable.
Use the middle and smaller views for detail
The four-hour view can show how a move developed inside the daily structure. The hourly view can show recent reactions near an area you already identified. A short-term rise can exist inside a broader decline; both observations can be true.
Zoom and expand a panel when needed. Keep track of which panel you are editing. The multi-chart product guide explains layouts, saved chart work and returning to the full view.
What if the charts disagree?
Do not force every timeframe into the same conclusion. Write down what each view actually shows and the condition that would change your interpretation. “Daily range, recent hourly rise” is more informative than a single bullish or bearish label that hides the difference.
You can ask AI chart chat to explain the current chart. To discuss another panel, open that context and check the response. Do not assume a response to one chart has independently analysed every panel in your workspace.
Use these AI prompts for conflicting timeframes to separate visible evidence from assumptions.
A comparison checklist
| Check | Why it matters |
|---|---|
| Instrument and source | Similar tickers can refer to different markets or contracts. |
| Candle interval | An hourly signal does not describe the entire daily structure. |
| Current candle | An unfinished candle can change shape before it closes. |
| Indicator settings | Different periods or smoothing change what you are comparing. |
| Available history | A shorter history may hide older levels or use a labelled historical source. |
Does agreement across charts prove a setup?
No. Several timeframes come from related price data, so their agreement is not independent evidence of future returns. The purpose of the layout is to expose context and contradictions. Review market conditions and risk independently; a chart pattern or AI answer can be wrong.
Educational product guidance, not financial advice. AI can be wrong. Examples are not trade recommendations.