
Market guides
Stock charts: research shares and ETFs with context
Free stock and ETF charts can help you study price history, compare timeframes and record your own observations. Begin by identifying the instrument, session and data source: a company name alone does not tell you which market or price you are viewing.
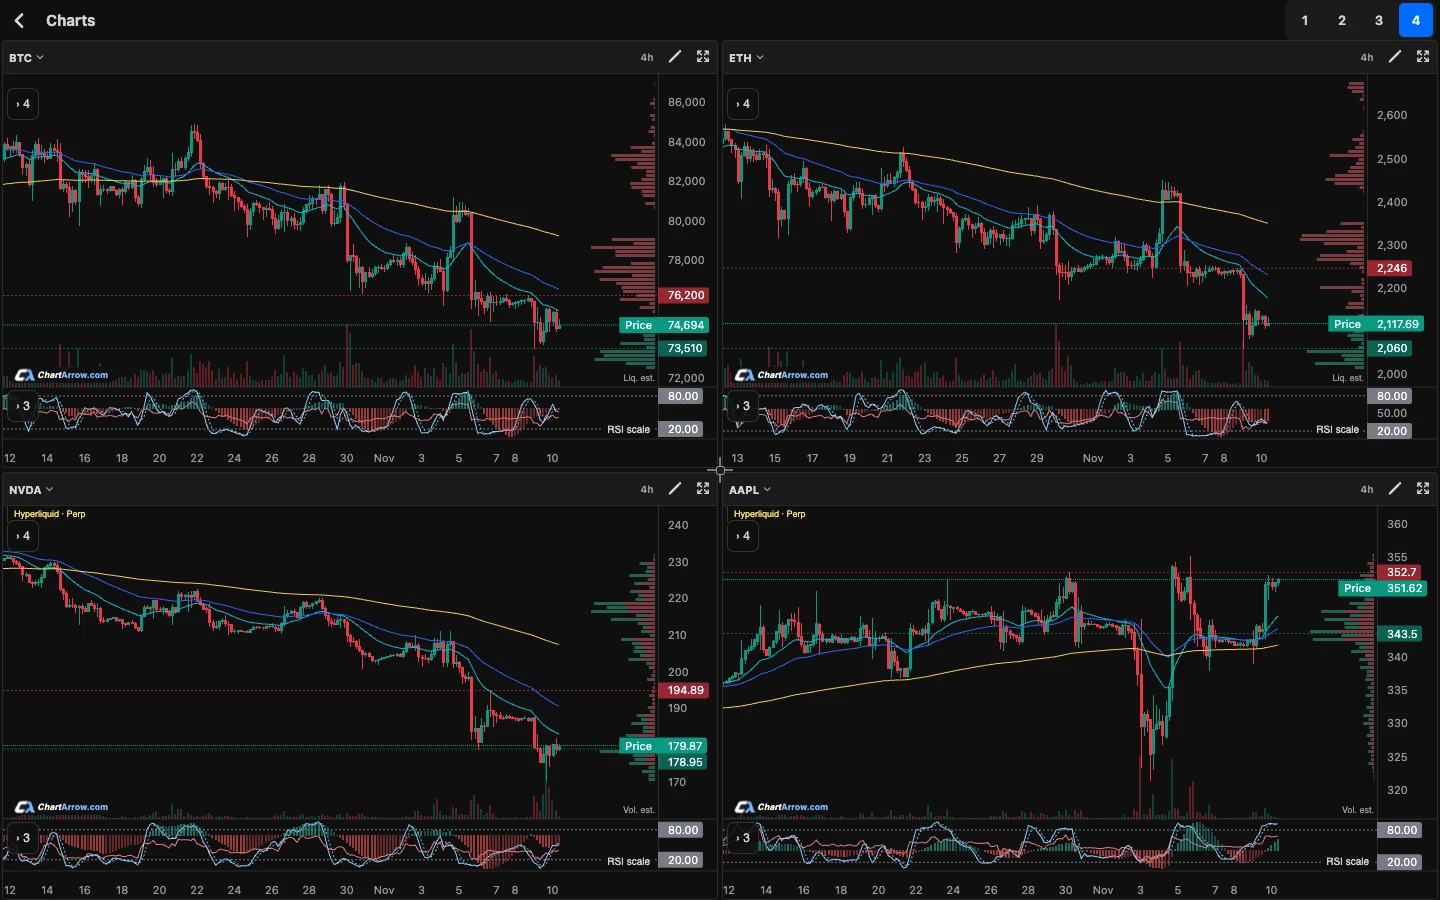
Is this a share, an ETF or a derivative?
A share represents a company’s equity; an ETF is a fund whose shares trade on a market. A stock-linked perpetual is a separate derivative and is not ownership of the underlying shares. In ChartArrow, supported stock-linked perpetuals can have separately labelled quotes that differ from regular-session share prices. Read the share and perpetual guide before comparing them.
Confirm the selected symbol, instrument type, source and any delay label. Coverage and data timing vary by instrument. If a quote differs from another service, compare the instrument and timestamp before assuming either price represents the same market.
How do market sessions affect a chart?
Regular trading, pre-market and after-hours sessions can have different liquidity and prices. A regular-session close, an extended-session quote and a perpetual price describe different observations. Session availability and display depend on the instrument and source; check the labels rather than assuming every session is included. For more on extended-hours trading, see the SEC investor bulletin. Exchange schedules and holidays vary; consult the relevant calendar, such as NYSE hours and calendars.
Why check corporate actions and data history?
Splits, dividends and other corporate actions can affect how a historical price series is presented. Before comparing an old level with today’s price, check the data provider’s adjustment method where available. A split-adjusted series and an unadjusted series may show different historical prices; do not assume a gap or level means the same thing on both.
Some supported stock-linked perpetuals have shorter histories. ChartArrow can label older share history where it extends beyond the perpetual’s available range. That boundary is not a continuous record of perpetual trades. See the guide to labelled history.
A practical stock or ETF chart exercise
- Select a supported stock or ETF and record the instrument, source, session, delay and observation time as labelled.
- Mark a recent range on a broader timeframe, then look at a shorter timeframe for reactions around its edges. Compare completed candles rather than assuming an unfinished candle is final.
- Check whether a major company event or corporate action could affect the period you are studying, and look up how the source treats historical adjustments.
- Write an alternative explanation for the pattern and the evidence that would challenge your first interpretation.
Use the support and resistance guide and multi-timeframe walkthrough to refine the exercise. A chart observation is not proof of future performance.
What can I ask AI about a stock chart?
On the chart you are viewing, an eligible account can try:
“Identify the visible trend and a plausible alternative on this chart. Which candles support each reading, what would challenge it, and what session, corporate-action or other context might be missing?”
Verify the instrument and levels yourself. Available GPT, Claude and Grok models offer different perspectives subject to account access, and AI drawings are editable. AI can miss context or be wrong; consult the AI chart analysis guide for its scope.
Are stock and ETF charts free?
ChartArrow’s charts, watchlists, indicators, drawings and layouts of up to four panels are free. Eligible accounts can try one AI analysis and a daily chat allowance; paid plans add AI usage. Check current plans and allowances and the app’s instrument labels for availability and delay.
Use ChartArrow in a browser or add it to an iPhone Home Screen. Drawings and per-ticker layouts are saved on the same device. Price, RSI and Stochastic alerts can help you monitor a condition; see alerts. ChartArrow does not hold funds or execute orders.
Educational information, not financial advice. AI can be wrong.