
Choosing your tools
AI trading tools: chart analysis, signals and bots explained
AI trading can describe very different products: a chart assistant, a signal service, a strategy-testing tool or software that places orders. ChartArrow provides AI-assisted chart research and editable drawings. Its charting and AI features do not hold funds or execute trades.
What does an AI trading tool actually do?
Check the output and permissions before judging the label. A tool that explains a chart is different from one that sends a trade signal or controls an exchange account. Automation may use fixed rules rather than AI, and a product mentioning AI may still require manual decisions.
| Category | Typical output | What to establish |
|---|---|---|
| Chart-analysis assistant | A discussion of visible patterns, levels or alternative interpretations; sometimes chart annotations. | What chart context it receives, whether the explanation matches the data, and whether drawings are editable. |
| Signal service | A proposed direction, level or alert for the user to consider. | Who provides it, how results are measured and whether signals remain suggestions or trigger orders elsewhere. |
| Strategy research / testing | Rules, simulated trades and historical results. | Data quality, trading costs, out-of-sample evaluation and the difference between simulation and live execution. |
| Trading bot / execution system | Orders submitted under configured rules and permissions. | The actual broker or exchange connection, permissions, position limits, monitoring and ways to stop execution. |
These categories can overlap in other products. Do not infer order permissions, account connectivity or audited results from a chat interface, a candlestick screenshot or an AI-generated explanation.
Where does ChartArrow fit?
ChartArrow is a browser charting and analysis workspace. Available GPT, Claude and Grok models can discuss the chart context, answer follow-up questions and create drawings you can edit. The AI chart-analysis guide explains those capabilities in detail. Access and usage depend on your account and plan.
Free charting tools include watchlists, indicators, drawings and up to four chart panels. Price, RSI and Stochastic alerts track configured conditions; an alert is not an executed trade or proof that a setup is reliable. Drawings and per-ticker layouts are saved on the same device.
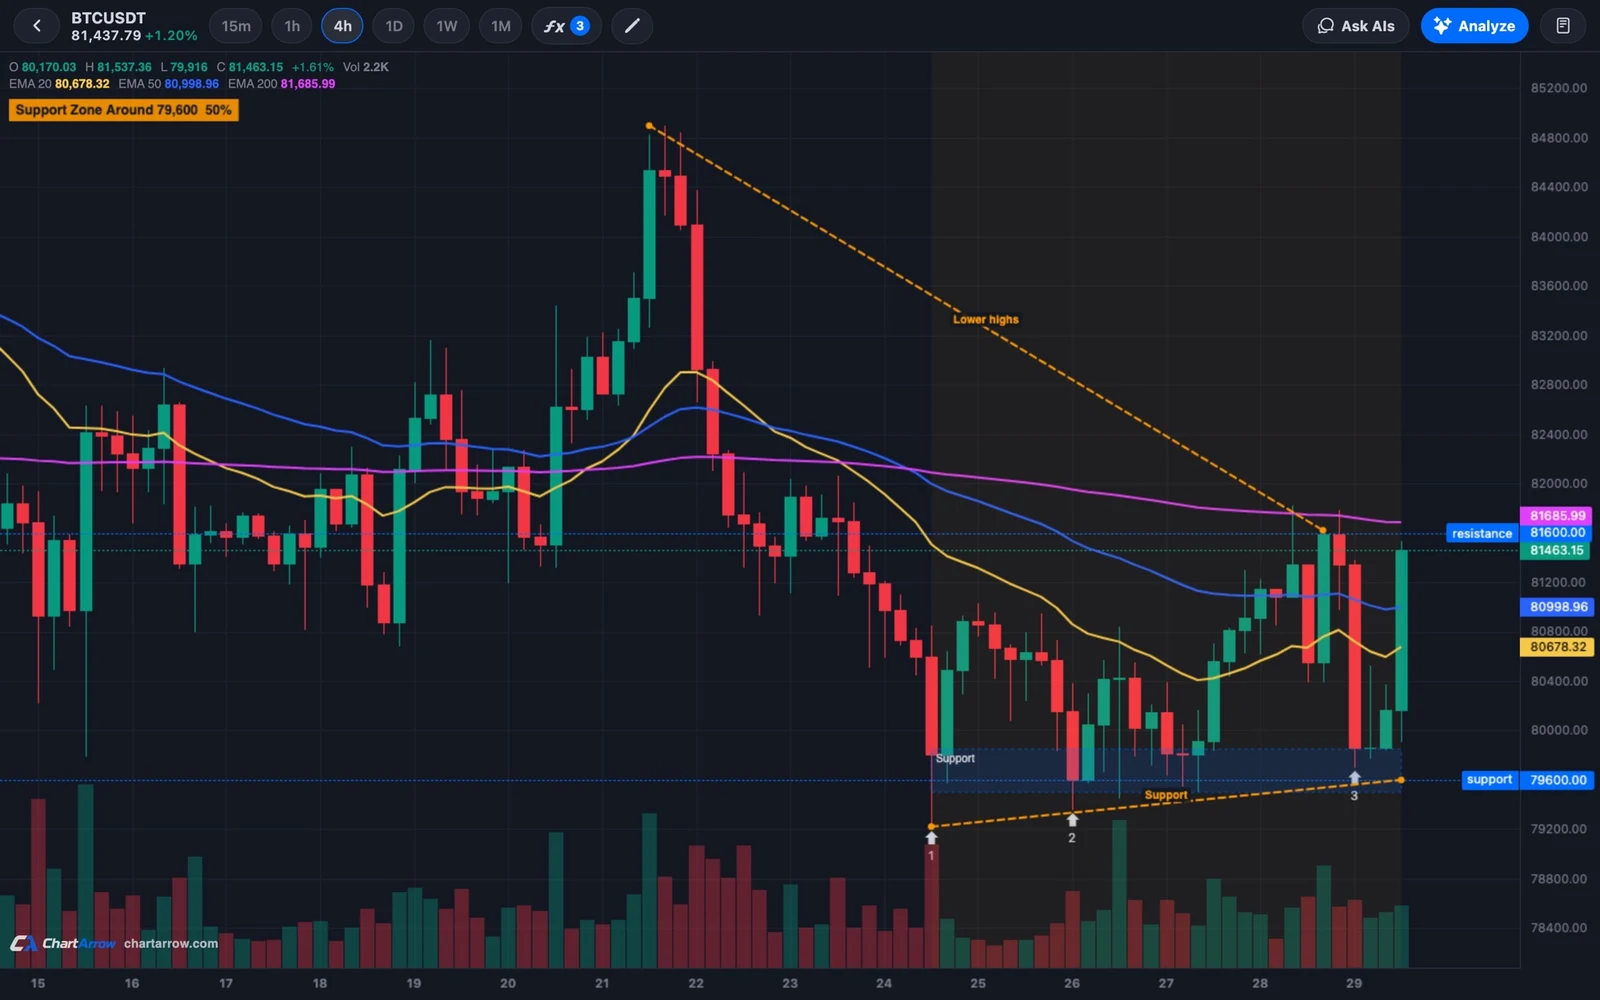
A practical AI chart-research workflow
- Fix the context. Choose a supported instrument and timeframe. Check the source label and whether the candle is complete. For crypto, distinguish spot pairs from derivatives; for stocks, distinguish shares from stock-linked perpetuals.
- Describe what you see. Identify the range, recent highs and lows, and one area of repeated price reactions before naming a pattern.
- Ask an answerable question. Request evidence and uncertainty rather than a direction alone. Use the example below or the prompt library.
- Review and correct. Compare the response with the candles. Adjust a drawing or ask the model to explain a mismatch. Comparing models can expose different assumptions; agreement does not establish a known success rate.
- Record the conclusion and limits. Note the symbol, source, timeframe, observation time and what would change the interpretation. Keep any trading decision and execution process separate.
Explain two plausible interpretations of this chart. For each, point to visible evidence and say what would challenge it. If the available chart context is insufficient, say what is missing.
For a concrete learning exercise, follow support and resistance zones or compare RSI and Stochastic readings. For several timeframes, review each panel's context rather than assuming one response has considered every chart.
How should you evaluate an AI trading app?
Start with the task, then examine access, evidence and cost. The questions below help distinguish an analysis tool from a service managing money or execution.
- What information does it receive? Ask which symbol, timeframe, source and other context are available. A confident answer can omit important information.
- Can you inspect the result? Look for explanations that refer to visible evidence, acknowledge uncertainty and allow corrections.
- What permissions are required? Establish whether the service merely shows charts or can read account balances, place orders or transfer funds.
- What do performance figures mean? Ask whether results are simulated or live, how the sample was selected and whether fees, slippage and losing periods are included. A selected winning screenshot does not answer those questions.
- What happens when something fails? For any execution product, investigate order failures, connection loss, monitoring and position controls before trusting automation.
- What is the full cost? Separate charting access, AI usage, market-data fees and any broker or exchange charges. Review current limits rather than assuming unlimited use.
Can AI predict the market or guarantee profit?
No AI chart explanation establishes a guaranteed outcome. A model can miss context, misread a level or produce a plausible but incorrect explanation. Historical results and model agreement do not establish future returns. ChartArrow does not publish an audited AI trading success rate.
The CFTC's advisory on AI trading claims warns about promises of high or guaranteed returns. Investor.gov's AI investor alert also explains the risks of misleading AI investment claims. These are general educational sources, not endorsements of ChartArrow.
How does this relate to TradingView and MetaTrader?
If you are choosing an AI-assisted chart-research workspace alongside another platform, compare the actual jobs rather than assuming compatibility. The TradingView comparison covers charting and scripting workflows. The MetaTrader comparison separates chart analysis from broker execution and Expert Advisors.
Using ChartArrow alongside either platform means separate chart research. This guide does not claim a TradingView plugin, MetaTrader Expert Advisor, automatic drawing import or connected trading account. For a broader selection checklist, see how to choose charting software.
Sources and product scope
Reviewed 15 November 2026. ChartArrow publishes this explanation about its own charting and AI features. Product scope follows the ChartArrow service terms; current free allowances and paid AI limits appear under pricing. The linked CFTC and Investor.gov guidance provides context for evaluating AI investment claims. This page explains tool categories; it is not a trading strategy or recommendation to use automated execution.
Published by ChartArrow about its own product. Educational information, not financial advice. AI can be wrong.